Back in my school time it was just one of the ways we had to do variable selection in a regression model, when we had many variables. I did not consult the literature but my feeling is that by then people just were not aware of the problems of stepwise regression. Nowadays if you try to defend Stepwise Regression in a table with statisticians they will shoot you down.
It is not difficult to find papers discussion the problems of Stepwise. We have two examples here and here. I think one of the problems with Stepwise selection is the one I said above, it take out of the hands of the researcher the responsibility of thinking - the computer decides what should be in the model, what should not, using criteria not aways understood by those who runs the model. Another problems is the overfitting or capitalization on chance. Stepwise is often used when there are many variables and these are precisely the cases where you will easily have some variables in just by chance.
 |
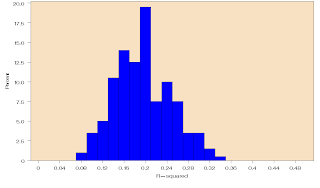
| R-Square for 200 simulations where 100 random variables explain a dependent variable in a dataset with 1000 units. |
The overfitting is easily seem in Discriminant Analysis as well, which also has variable selection options.
 |
| R-Square for 200 simulations where 100 random variables explain a dependent variable in a data set of 300 units. |
Depending on the nature of the variable an interesting approach could be to run an exploratory Factor Analysis or Principal Component Analysis and include all the factors in the model.
Hopefully Stepwise Regression will be used with more caution if used at all. Below you have the SAS code I used to generate the simulations for these two histograms. I am not very good SAS programmer, I am sure someone can write this in a more elegant way... Sorry I did nto have time to insert comments...
%macro step;
%do step=1 %to &niter;
%put &step;
data randt;
array x[&nind] x1 - x&nind;
do i = 1 to &ncases;
y=rand('UNIFORM');
do j = 1 to &nind;
x[j] = rand('UNIFORM');
end;
output;
end;
run;
proc reg data = randt outest = est edf noprint;
model y = x1 - x&nind/selection = stepwise adjrsq;
run;
%if &step > 1 %then %do;
data comb;
set comb est;
run;
%end;
%else %do;
data comb;
set est;
run;
%end;
%end;
%mend step;
%let nind = 100;
%let ncases = 1000;
%let niter = 200;
%step;
proc univariate data=Work.Comb noprint;
var _RSQ_;
histogram / caxes=BLACK cframe=CXF7E1C2 waxis= 1 cbarline=BLACK cfill=BLUE pfill=SOLID vscale=percent hminor=0 vminor=0 name='HIST' midpoints = 0 to 0.5 by 0.01;
run;
2 comments:
Hi,
Do you know of any papers that have used the method you suggested to include random variables in the stepwise regression? I've been googling terms such as "stepwise regression include random variable" and cannot find any examples.
Thanks!
Hi,
Do you know of any papers that have used the method you suggested to include random variables in the stepwise regression? I've been googling terms such as "stepwise regression include random variable" and cannot find any examples.
Thanks!
Post a Comment